Illuminated Point Symbology

This will be a quick one, I’ll overview how I created the glowing/heat effect on the GISP location points in my GISP map. The points represent cities where there is a GISP certification. These points also have an attribute for the number of GISP’s in that city but I will not be representing that information […]
Open an ArcMap [.ai] Export in Illustrator
![Open an ArcMap [.ai] Export in Illustrator Open an ArcMap [.ai] Export in Illustrator](https://www.bgcarto.com/wp-content/uploads/2012/06/ai-FI-150x150.jpg)
So you’ve read the last article, Some Tips on Map Layout & Exporting a Map to Illustrator and you set up a map layout in ArcMap with the intent to finish the cartographic design in Illustrator. Well there’s a few more things you should know about opening that file in Illustrator. I always rework the […]
Some Tips on Map Layout & Exporting a Map to Illustrator

If you’d like to finish a map with Adobe Illustrator, that you started in ArcMap, there are a few quirks and best practices you should know about when exporting that map from ArcMap. If you stick with these guidelines/tips, it will make your life a little easier when you get into the Illustrator workspace. First, […]
Utilizing QR Codes on Maps

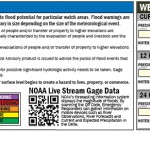
For the Delta Emergency Flood Response Mapbook, our team decided to use QR (quick response) codes to give our static, print, mapbook a dynamic and interactive element. The QR codes we used in the mapbook allow flood responders (with a smart phone app that can read QR codes) to quickly access real-time weather data as […]
Fusion Table InfoWindow

I set this web map up to communicate some personnel stats for planning staff. The client didn’t want a static map. Using a fusion table/map is a fairly easy way to set up a nice looking interactive map. One of the cool features of this one is the dynamic charting in the infowindow for each […]


