Grid of measured points with python
I’ve needed to create a measured grid of points for a variety of reasons in my GIS career. Here’s a flexible bit of code to create a grid of points spanning a vertical and horizontal range, at a specific interval for each – defined in the script. This method also allows any coordinate system and unit to be applied to the coordinates. This is defined when plotting the points (in QGIS or ArcMap).
The code below will create a csv file that contains an array of point coordinates. The variable hstart is horizontal start value, hend is the horizontal end, the hinc is the horizontal increment, and the hor list is an empty list that will be filled with every value from hstart to hend at the hinc (0-20 by 1 – 0,1,2,3,4,5…). The next block is identical for the vertical range of values. The next two loops populate the hor and vert lists by looping through the range of values by each defined increment.
The loop after coord is defined, (for a in hor:) is the loop that creates all the coordinate pairs needed. For every value in the hor list, it loops through each value in the vert list and concatenates them into a coordinate pair that is added to the coord list.
The print coord line returns:
[‘0,0’, ‘0,0.5’, ‘0,1.0’, ‘0,1.5’, ‘0,2.0’, ‘0,2.5’, ‘0,3.0’, ‘0,3.5’, ‘0,4.0’, ‘0,4.5’, ‘0,5.0’, ‘0,5.5’,….]
The final loop prints all the coordinate pairs to a csv file after printing “x,y” to the first line. This loop prints “x,y” then a new line “\n” and the current coordinate pair.
text = r"C:\Users\brian\Desktop\point_grid.csv" hstart = 0 hend = 20 hinc = 1 hor = [] vstart = 0 vend = 10 vinc = 0.5 vert = [] i = hstart while i <= hend: hor.append(i) i += hinc t = vstart while t <= vend: vert.append(t) t += vinc print hor print vert coord = [] for a in hor: x = a for b in vert: y = b z = str(x)+","+str(y) coord.append(z) print coord with open(text,"w") as text_file: text_file.write("x,y") for c in coord: line = "\n"+str(c) text_file.write(line) |
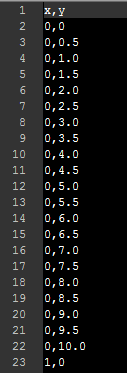
I run this code through the python command line in ArcMap. The output csv looks like this.
You can plot the XY pairs in ArcMap, but I actually much prefer the QGIS interface and csv handling, that’s what I used in the process and that’s what I will show here.
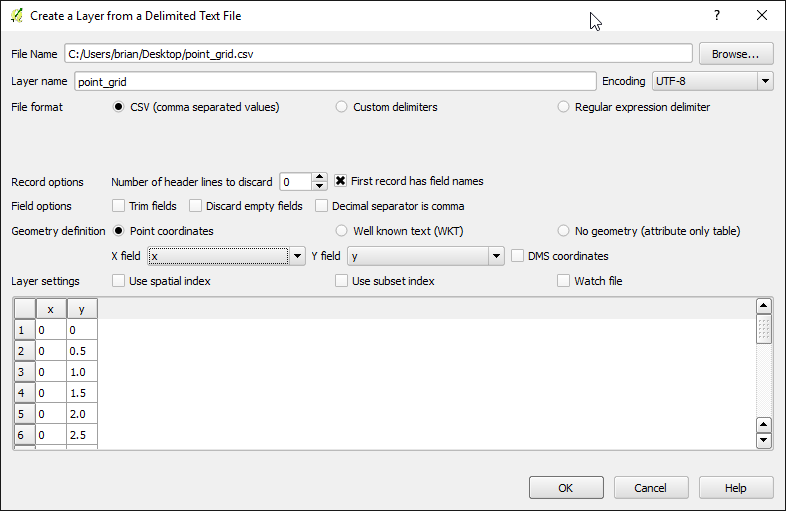
Launch QGIS desktop and hit the add delimited text layer, browse to and select the csv created with the script above. X and Y field are defined by the header line from the csv “x,y” set as seen below, make sure DMS coordinates is unchecked to set a coordinate system in the next window, then hit ok.
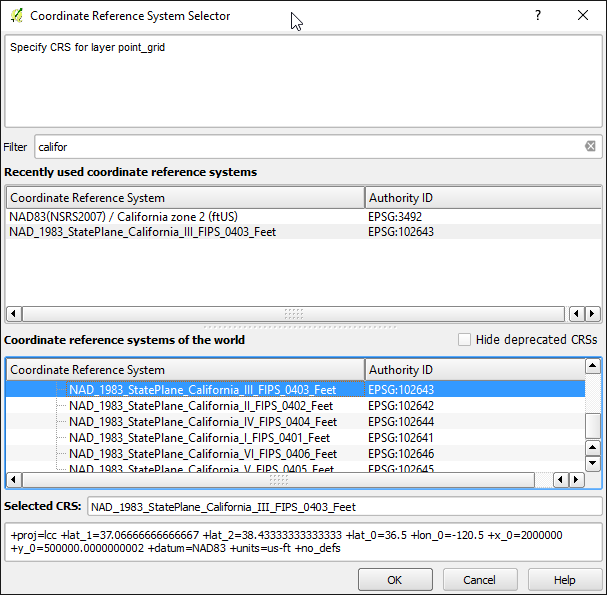
Next, I define a coordinate system and this is somewhat arbitrary, but I’m using a projection with feet as the native unit.
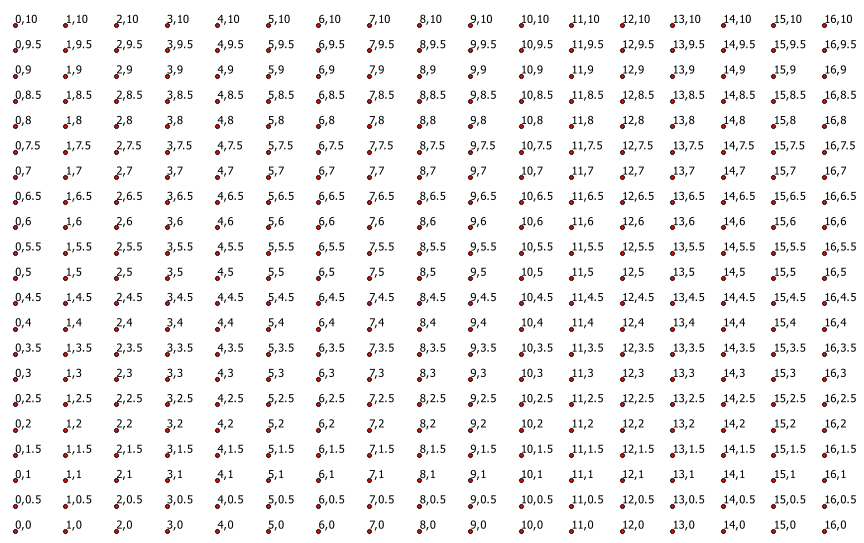
Here’s a portion of the grid of points, symbolized and labeled.